
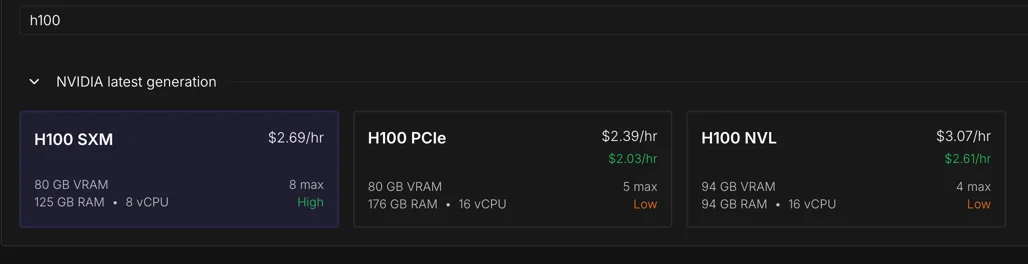
Training to GPT-2 level performance on CORE metric 1Marginnote recent_benchmark1https://github.com/karpathy/nanochat/discussions/481 ↩ has dropped from $43K in 2019 to $73 in 2026. I wanted to train Nanochat 2Marginnote nanochat2“The best ChatGPT that $100 can buy.” Nanochat Repository ↩ on spot instances, where Karpathy mentions the cost can be even lower to $20 on 8xH100 GPUs. But, on Runpod, I was confronted with a choice - H100 PCIe, SXM or NVL. Each at varying price points.
I knew these were different network interconnect options from the CS336 course 3Marginnote cs3363lecture 5 https://www.youtube.com/watch?v=6OBtO9niT00 ↩ and that NVLink 4.0 was supposed to be fast.
Prof. Percy Liang mentions in the first lecture of CS336, the mindset while training LLMs is to squeeze most performance of the hardware. Every decision has an effect. This led me to examine what each of these interconnect variants has to offer.
To train the model cheaply, is the cheapest instance the best choice to complete the training run? I decided to benchmark all three.
Why care about the network interconnect?
While training on multiple GPUs, most parallelism techniques use the interconnect to transfer gradients at every step.
The current implementation of Nanochat takes about 3 hours to train on an 8xH100. The optimizer is the only distributed component.
Nanochat uses a combined Muon + AdamW optimizer 4Marginnote distmuonadamw4DistMuonAdamW optim.py ↩. Muon handles all large 2D matrices, attention projections (Q, K, V, O) and MLP weights (c_fc, c_proj) plus the tiny Value Embedding Gates. AdamW for the rest: input token embeddings (wte), LM head, Value embeddings, and two small residual addition scaling parameters (x0_params and resid_params). The optimizer runs in two stages: phase 1 is for reduce ops and phase 2 is for gather ops.
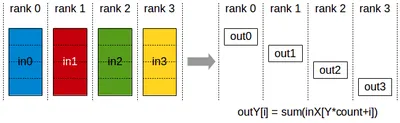
Phase 1 averages gradients across devices5Marginnote devices5Think of devices as a host having multiple GPUs. Each GPU has a rank (its ID) ↩.
all_reduce and reduce_scatter primitives are used for this.
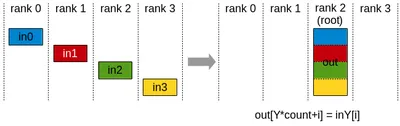
In Nanochat, all_reduce is used for tiny parameters (under 1024 elements), each rank receives the full averaged gradient in a single collective.
Since these are just a few KB, the overhead to send them to all ranks is negligible.
reduce_scatter the sharded alternative, handles rest of the parameters, each GPU receives 1/8 of the averaged gradient.
Phase 1
reduce_scatter(grads)
  GPU 0 → avg_grad[0:N/8]
  GPU 1 → avg_grad[N/8:2N/8]
  ...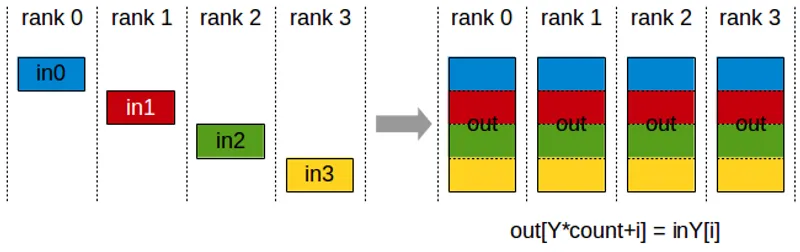
Then in phase 2, each rank runs the optimizer on its shard in isolation, producing updated parameters for that slice.
After this, all_gather lets every rank collect all the shards, so each rank has the full updated parameter tensor for next forward pass.
Phase 2
optimizer(shard) → updated params
all_gather(params)
  GPU 0 → params[0:N/8]
  GPU 1 → params[N/8:2N/8]
  ...
  → all ranks get full params[0:N]
This is the Zero-2 6Marginnote zero_26Zero Stage 2 Paper ↩ pattern. Each GPU only needs optimizer state (momentum, variance buffers) for its shard, cutting memory to 1/world_size7Marginnote world_size7world_size - Total number of GPUs ↩. I strongly recommend watching Lecture 7 8Marginnote lecture78Lecture 7 - CS336 ↩ in CS336 to get a deeper idea.
All figures above are from Nvidia’s NCCL documentation, which has great visualisation to understand this.
Analytical estimates of the data transfer for d26 Nanochat
From the Nanochat model architecture, we can estimate the data transfer required for each parameter group. The optimizer moves data in two phases: ReduceScatter to average gradients, then AllGather to distribute updated parameters.
Each optimizer step transfers roughly 7.1 GB across the interconnect. ~3.6 GB in AllGather (bf16), ~3.6 GB in ReduceScatter (split between bf16 and f32), and a negligible AllReduce for the two small lambda parameters. We get this value by adding the tensor sizes across all parameter groups - lm_head, wte, value_embeds, and the Muon-managed transformer blocks.
Per-group communication volume & NCCL op summary (per optimizer step)
| group | kind | num_params | padded_count | elements_per_param | total_elements | RS (MB) | AG (MB) | AR (MB) |
|---|---|---|---|---|---|---|---|---|
| lm_head | adamw | 1 | 1 | 54,525,952 | 54,525,952 | 109.1 | 109.1 | 0 |
| wte | adamw | 1 | 1 | 54,525,952 | 54,525,952 | 109.1 | 109.1 | 0 |
| value_embeds | adamw | 13 | 13 | 54,525,952 | 708,837,376 | 1417.7 | 1417.7 | 0 |
| resid_lambdas | adamw | 1 | 1 | 26 | 26 | 0 | 0 | 0 |
| x0_lambdas | adamw | 1 | 1 | 26 | 26 | 0 | 0 | 0 |
| muon (13, 32) | muon | 13 | 16 | 416 | 6,656 | 0 | 0 | 0 |
| muon (1664, 1664) | muon | 104 | 104 | 2,768,896 | 287,965,184 | 575.9 | 575.9 | 0 |
| muon (1664, 6656) | muon | 26 | 32 | 11,075,584 | 354,418,688 | 708.8 | 708.8 | 0 |
| muon (6656, 1664) | muon | 26 | 32 | 11,075,584 | 354,418,688 | 708.8 | 708.8 | 0 |
NCCL op summary per step (compare with nsys CUDA GPU Kernel Summary)
| nccl_op | dtype | calls_per_step | total_MB | avg_MB_per_call | min_MB_per_call | max_MB_per_call |
|---|---|---|---|---|---|---|
| AllGather | bf16 | 19 | 3629.4 | 191 | 0 | 708.8 |
| AllReduce | bf16 | 2 | 0 | 0 | 0 | 0 |
| ReduceScatter | bf16 | 15 | 1635.8 | 109.1 | 109.1 | 109.1 |
| ReduceScatter | f32 | 4 | 1993.6 | 498.4 | 0 | 708.8 |
That 7.1 GB is the tax every single training step pays.
Choice of H100
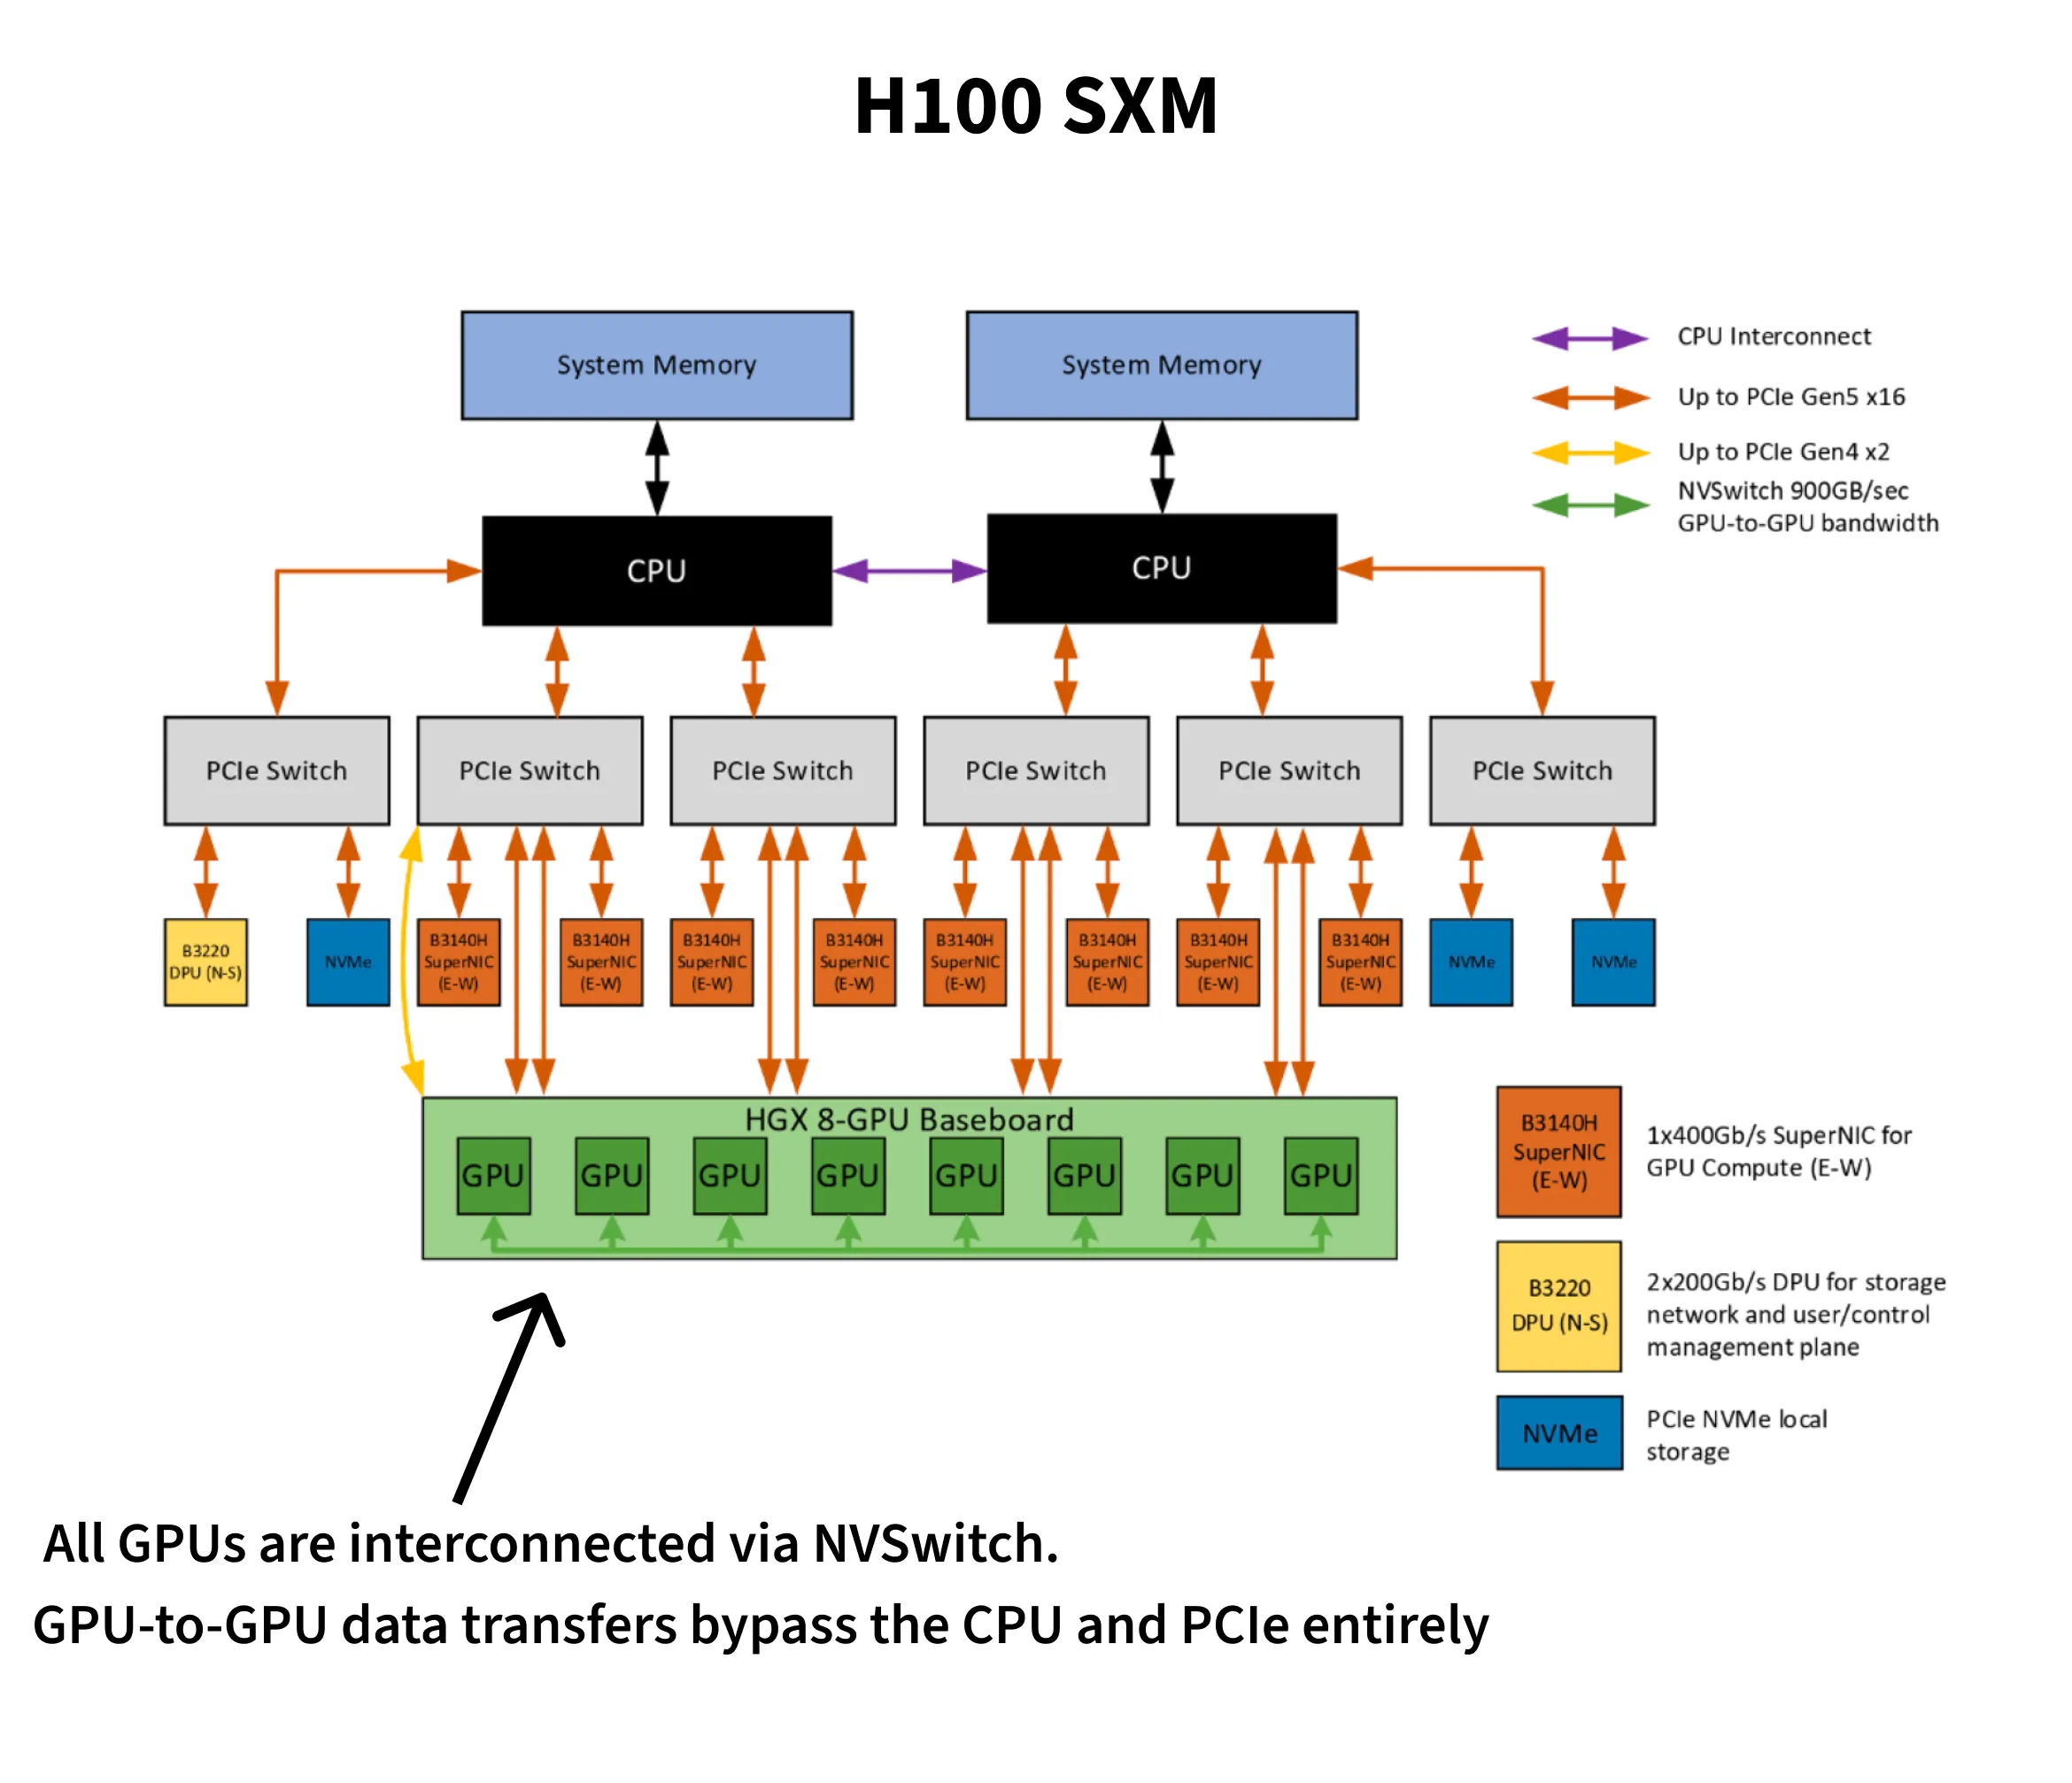
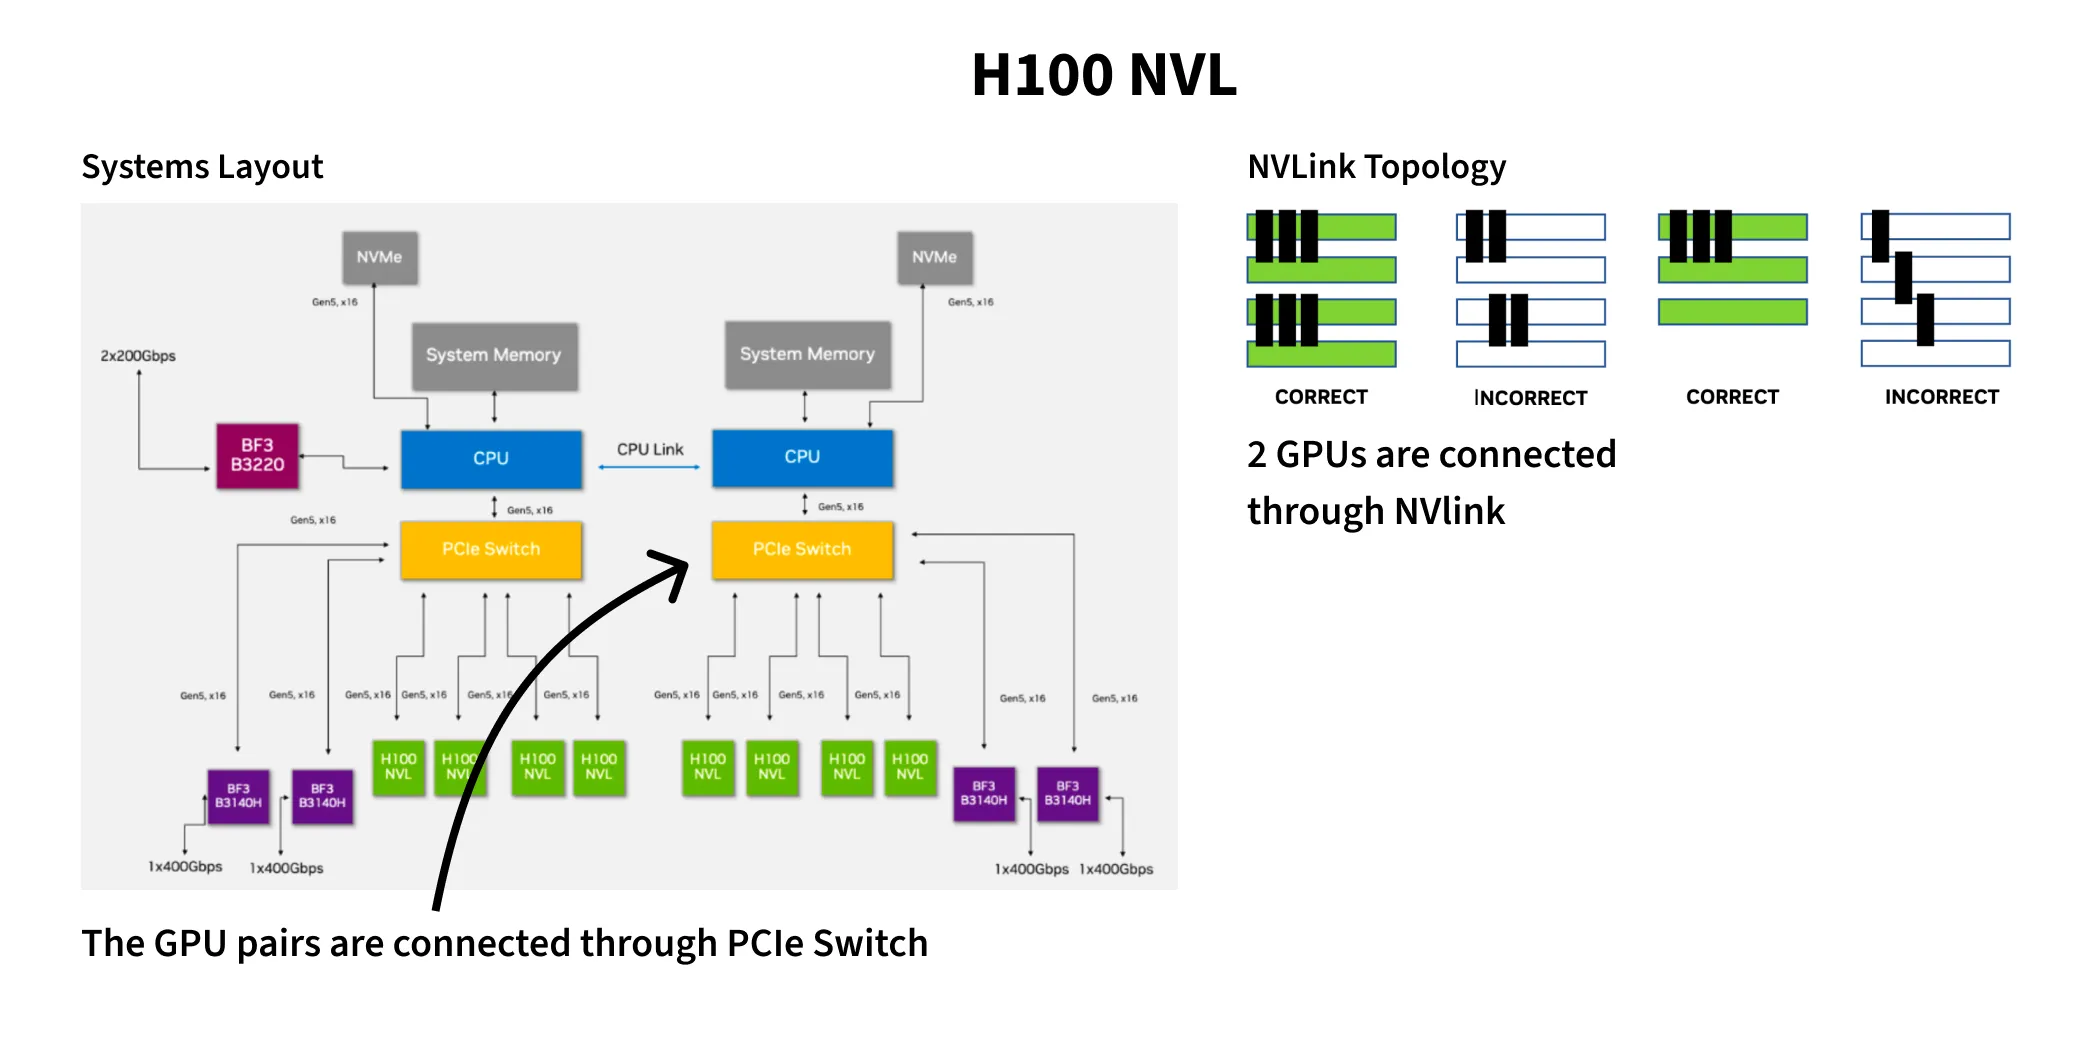
Back to our first question, which H100 instance to choose? Most providers offer the H100 in two form factors SXM and NVL 9Marginnote h100_offering9Nvidia H100 specification ↩.
SXM variant is a custom baseboard from Nvidia, whereas NVL is installed through the PCIe dual-slot. The FP8 FLOPs on SXM are 3958 vs 3341 on NVL. You can interconnect the GPUs through NVLink or PCIe. NVLink offers 900GB/s on SXM vs 600GB/s on NVL, and just 128GB/s on PCIe. One important note is that on NVL instances, only two GPUs can be connected through NVLink. Within a pair NVLink on NVL gives 300GB/s per direction, and cross-pair traffic falls back to PCIe. On SXM instances, NVSwitch connects all GPUs in a mesh providing 450GB/s per direction.
They also differ in max thermal design power. SXM can go up to 700W while NVL peaks at 400W. Horace He wrote a fun blog10Marginnote horace_he10https://www.thonking.ai/p/strangely-matrix-multiplications ↩ about how data values affect power draw. Predictable data - complete zeros or ones flip fewer transistors, leading to less dynamic power and in turn better clock speeds. The main takeaway is higher power draw unlocks better clock speeds and, in turn, better FLOPs per dollar.
Runpod is one of the few providers to offer all three - SXM, NVL and PCIe. The cost for SXM is higher than PCIe but cheaper compared to NVL. Vast.ai also has SXM configuration at varied price points for both on-demand and spot instances, in many cases, cheaper than Runpod’s SXM.
| Runpod PCIe | Runpod NVL | Vast.ai SXM | Runpod SXM | |
|---|---|---|---|---|
| 8-GPU node/hr (on-demand) | $19.12 | $21.52 | $12.85 | $21.5 |
| 8-GPU node/hr (spot) | $10 | $13.2 | $7-$10 | $14 |
The theoretical bandwidth ratio between NVLink (~450 GB/s per direction on SXM) and PCIe 5.0 (~64 GB/s per direction) is roughly 7x 9. If that ratio holds in practice, SXM should recoup its price premium on interconnect savings alone.
Benchmarks
My initial hypothesis was SXM instances were more expensive per hour, but they would be cheaper to complete the training run.
From the nanochat leaderboard11Marginnote leaderboard11d26 + FP8 link ↩, the d26 GPT-2 record uses --target-param-data-ratio=8.5 with FP8, training on ~7.8B tokens at batch size 524,288 for 14,889 steps to reach CORE 0.2578 (original GPT-2: 0.2565).
Each step has the model forward, backward and the optimizer step.
The first two runs I did were on SXM and PCIe on Runpod. SXM had 160 vCPUs whereas PCIe had 252 vCPUs. However, the results were starkly different to my hypothesis. PCIe did better on overall training budget. Then I found a Vast.ai offering for 256 vCPU for SXM, which outperformed PCIe. To check if this improvement was purely due to vCPU sizing, I ran a 128 vCPU SXM on vast.ai and found it match the 256 vCPU SXM. In later sections, I detail about this disparity and the possible causes in the apparent regression of SXM 160 vCPU on Runpod. And finally, I benchmarked the NVL configuration for completeness.
In the results reported, I only talk about the three variants - SXM 128 vCPU (on vast.ai), PCIe 252 vCPU and NVL 128 vCPU on Runpod. The experiments that failed are in the final section.
I wrote this profiling script here 12Marginnote profile_comms.py12profile_comms.py ↩ which performs a warmup of 3 steps and then profiles 10 steps.
I use torch.cuda.Event to time each step.
This also isolates the optimizer’s average time, revealing network overhead.
I measured compute and network time separately, even though they overlap during normal training.
The measured times will be slightly higher than actual Nanochat training.
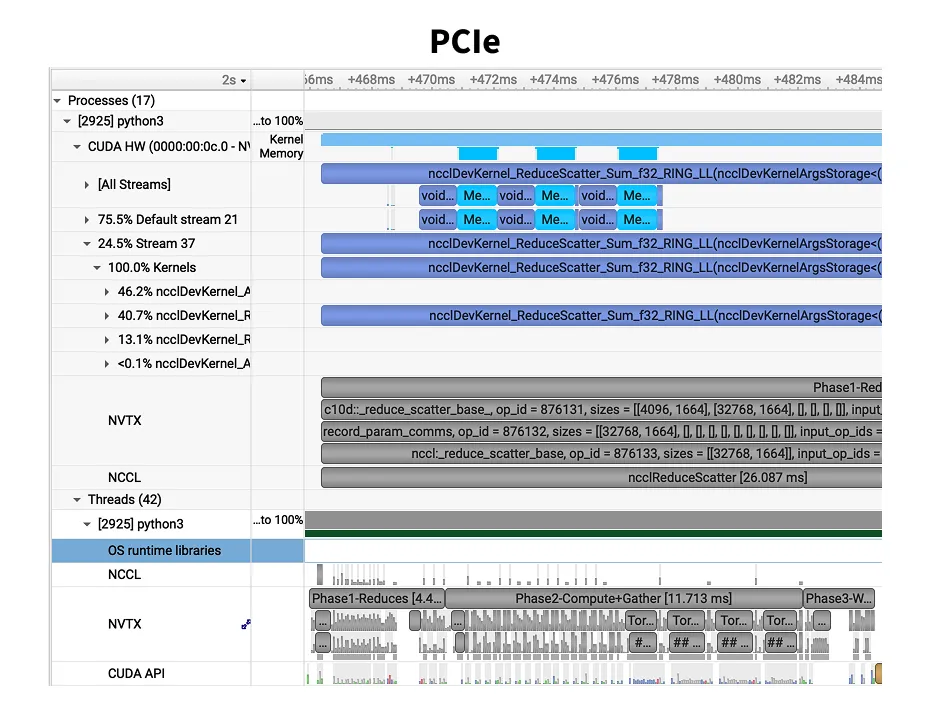
Nvidia’s nsys tool annotates specific parts of the script.
Through torch.cuda.nvtx.range_push we break down each operation’s timing.
The nvtx ranges and cuda events are split into three phases - Phase 1-Reduces, Phase 2-Compute+Gather, Phase 3-WaitGathers.
Phases 1 and 2 are GPU-intensive, performing network collectives and fused optimizer kernels respectively.
Phase 3 is a synchronization step where CPU waits on network completion.
Measured Step Times for d26
Profiled at device_batch_size=32, total_batch_size=524,288 (no gradient accumulation). The d26 GPT-2 record (Run 2) uses the same batch size with device_batch_size=16 and grad_accum=2, which produces equivalent step times.
SXM completes each step in ~702ms — nearly half the time of PCIe, and a third of NVL.
| Platform | vCPUs | Avg Step Time | Optimizer Step | Comm Overhead | Relative | Training Time |
|---|---|---|---|---|---|---|
| SXM (NVSwitch) | 128 | 701.9 ms | 57.8 ms | 8.2% | 1.00x | 2.90 hours |
| PCIe | 252 | 1411.6 ms | 375 ms | 26.6% | 2.01x | 5.84 hours |
| NVL | 128 | 2031.5 ms | 395.6 ms | 19.5% | 2.89x | 8.40 hours |
SXM’s NVSwitch mesh gives every GPU full bandwidth to every other GPU. PCIe is limited to ~64 GB/s per direction, and NVL only has NVLink within pairs — cross-pair traffic falls back to PCIe.
NCCL Communication
Measured GPU kernel execution times from Nsight Systems. All three runs produced the same total kernel call counts, enabling direct comparison of total times.
NVLink delivers a 7.3x reduction in total NCCL kernel time, matching the spec sheet’s 7x bandwidth ratio.
Per-Kernel Average Latency
From nsight, I exported the NCCL calls from the CUDA GPU Kernel Summary across all configurations.
SXM performs the best here. NVL has NCCL kernel times nearly identical to PCIe. NVL step time (2031 ms) is 44% worse than PCIe (1412 ms) even though NCCL kernel times are nearly identical. Beyond NCCL, on NVL, inter-pair traffic shares the PCIe bus with host-to-device transfers, starving both.
Model Size Sensitivity (d12 vs d26)
Does a smaller model show the same interconnect sensitivity? I profiled d12 (286M params, device_batch_size=32, grad_accum=1) alongside d26 for two configurations.
Smaller models are more communication-sensitive. d12 spends 23% in communication on SXM vs d26’s 8.2%. For small-model workloads, interconnect choice matters even more. Interestingly, Phase 1 time of NVL is faster than SXM for d12 likely because the small reduce volume fits within a single NVLink pair’s bandwidth, avoiding NVSwitch overhead.
d12 Optimizer Phase Breakdown
| Platform | Phase 1 | Phase 2 | Phase 3 | Total Optimizer |
|---|---|---|---|---|
| SXM 128 vCPU | 4.2 ms | 25.2 ms | 11.7 ms | 41.2 ms |
| NVL 128 vCPU | 2.7 ms | 36.3 ms | 23.4 ms | 62.3 ms |
Takeaways
SXM completes the training in nearly half the time of PCIe and a third of NVL. At $12.85/hr on Vast.ai, it’s also the cheapest per-hour option.
| Provider | Config | $/hr (8-GPU) | vCPUs | Step Time | Training Cost |
|---|---|---|---|---|---|
| Vast.ai | SXM | $12.85 | 128 | 701.9 ms | $37.27 |
| Runpod | PCIe | $19.12 | 252 | 1411.6 ms | $111.66 |
| Runpod | NVL | $21.52 | 128 | 2031.5 ms | $180.77 |
SXM configurations seem to be the norm from most providers. Runpod was the only provider to have all three configurations and offered them as spot instances. Vast.ai is a bit of a lucky draw essentially, since it’s a marketplace not all the configurations are available consistently. For shorter training runs like Nanochat, it is the best fit. Lambda.ai has 208 vCPU count and offers only SXM, Modal also offers only SXM and has a configurable CPU count since they are serverless.
Through this exercise, I now have a better intuition on how to train with spot instances.
The runpod_profile_comms.sh script has device checks early for cuda drivers and nccl communication so failure is fast.
Mistakes I made and issues I ran into
1. CPU starvation on the SXM run and NUMA socket pinning
My benchmark on SXM with 160vCPUs on Runpod clocked 1295ms per step, barely faster than PCIe’s 1412ms with 252 vCPUs. With higher FLOPs and faster interconnect SXM should have been a massive step-up, not a minor improvement.
Assuming it’s CPU starvation, I found a 256 vCPUs instance on vast.ai and got 702ms, 2x improvement.
Through Nsight Systems, I found the GPU kernels themselves were fast, but they spent long stretches idle, waiting for the CPU to signal the next chunk in NCCL’s ring protocol.
The pthread_cond_signal count was 1.58 million in a 10-step profile on the 160vCPU, vs ~4,000 on a healthy instance with 256 vCPUs.
Running more experiments on Runpod with NVL and PCIe, I ran into multiple issues - slow internet on the VM, CUDA driver issues and also NCCL misconfigurations.
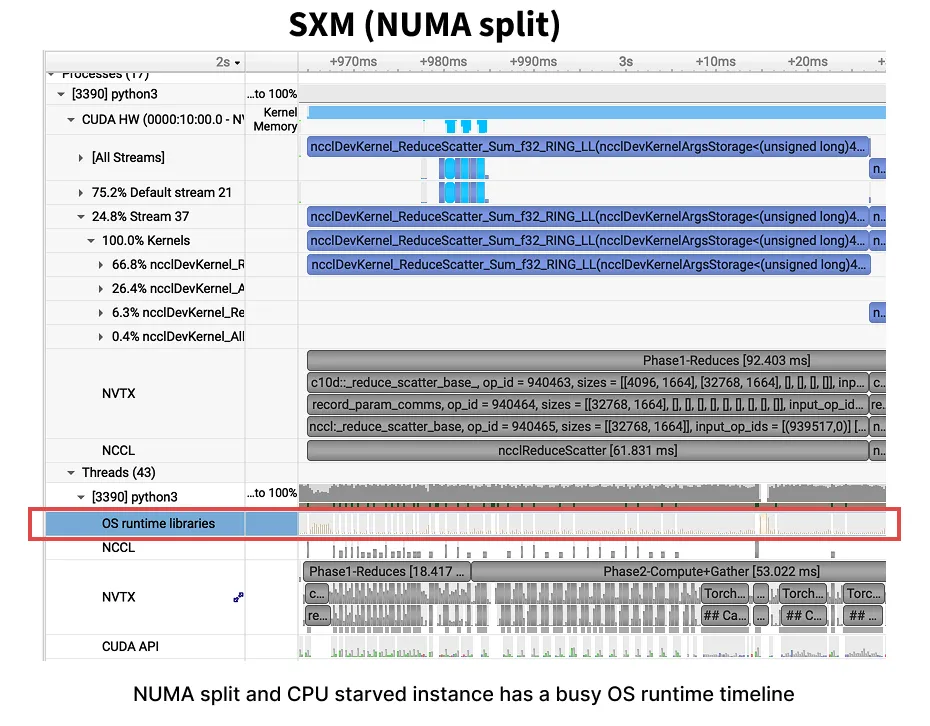
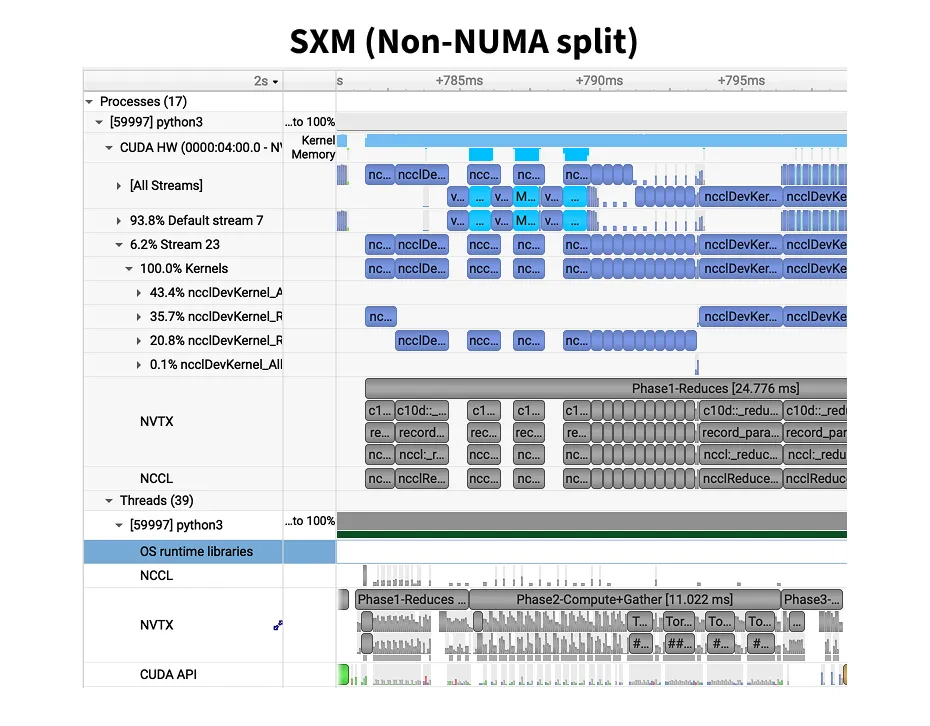
To ensure I was not fitting data to my narrative, I re-ran on Vast.ai with 128 vCPUs and got 701.9ms. Identical to the SXM with 256 vCPU. The CPU was not the only bottleneck. Dumping the machine topology revealed one clear difference. Runpod split GPUs 4+4 across two NUMA13Marginnote numa13Non-Uniform Memory Access is a memory layout design used in data center machines. Link ↩ nodes, while Vast.ai placed all 8 on NUMA node 0.
Multi-socket14Marginnote socket14A CPU socket is the physical connector on the motherboard that holds one CPU chip. A dual-socket server has two CPUs, each with its own local memory and PCIe lanes. ↩ servers have a NUMA (Non-Uniform Memory Access) architecture, each CPU socket has its own local memory.
Accessing local memory takes ~10ns, but reaching memory on the other socket crosses the UPI (Ultra Path Interconnect) at ~100ns.
When GPUs are split across NUMA nodes, NCCL’s CPU-side coordination threads, the ones signaling pthread_cond_signal and holding mutexes, pay this cross-socket penalty on every ring protocol step.
The OS scheduler makes it worse: without explicit pinning, it can schedule a thread managing GPU 5 (socket 1) onto a core on socket 0, turning every memory access and signal delivery into a cross-UPI hop.
numactl --cpunodebind=N --membind=N pins processes to a specific socket, but NCCL spawns its own internal threads which may not respect this.
The clean fix is what Vast.ai had: all 8 GPUs on a single NUMA node, so cross-socket latency never enters the picture.
GPU-to-GPU NVLink communication is unaffected by NUMA since the bits travel over NVSwitch (data plane), never touching the CPU.
But NCCL’s control threads, which orchestrate these transfers, run on the CPU (control plane).
There is active discussion on PyTorch to include NUMA pinning to torchrun - Link.
There were also CUDA driver version differences (560 vs 570) and different kernel configs. I haven’t isolated which factor dominates, I’ll cover it in a follow-up post.
Run
nvidia-smi topo -mon every new instance before benchmarking. If GPUs span multiple NUMA nodes, expect NCCL overhead. And always profile before trusting step times, a bad instance can masquerade as “SXM isn’t worth it.”
2. Spot instances being preempted mid-profile
Spot instances are 30 to 50% cheaper than on-demand instances. But the trade-off is they can be shut down at any point with a 5-second notice. Since the profiling takes roughly 12 minutes including installation, env setup and actual profiling, I was confident I could get the work done on spot instances. But I did run into shutdowns a couple of times.
3. Broken Nodes throwing CUDA errors
I ran into this issue a few times, where the host has not been configured correctly. Likely CUDA driver or GPU state was broken due to driver mismatch. Fixing this issue on the pod that is billed by the second is expensive. Shutting it down and trying at a later time is the best alternative.
>>> import torch, sys, os
>>>
>>> print(f'PyTorch {torch.__version__}, built with CUDA {torch.version.cuda}')
PyTorch 2.8.0+cu128, built with CUDA 12.8
>>>
>>> torch.cuda.init()
Traceback (most recent call last):
  File "<stdin>", line 1, in <module>
  File "/usr/local/lib/python3.12/dist-packages/torch/cuda/__init__.py", line 379, in init
    _lazy_init()
  File "/usr/local/lib/python3.12/dist-packages/torch/cuda/__init__.py", line 412, in _lazy_init
    torch._C._cuda_init()
RuntimeError: CUDA unknown error - this may be due to an incorrectly set up environment, e.g. changing env variable CUDA_VISIBLE_DEVICES after program start. Setting the available devices to be zero.
4. NCCL connection issues on NVL
On one of the community instances of 8xH100 NVL on Runpod, there was a NCCL communication issue.
The instance was unable to use SHM (Shared Memory), a fast inter-process transport using /dev/shm.
I tried benchmarking anyway by disabling SHM through NCCL_SHM_DISABLE=1.
NCCL uses SHM for Peer-2-Peer (P2P) communication. On an 8-GPU NVL node, only 4 of the 28 GPU pairs share NVLink. The remaining 24 pairs rely on PCIe via SHM, disabling it cripples 6 out of every 7 ring hops. When SHM is disabled, it falls back to using IP Sockets which are orders of magnitude slower.
So, I had to do another run on the secure cloud of Runpod which also had a NVL instance. This performed much better. This paper does a great job of explaining NCCL 15Marginnote demystifing_nccl15Paper ↩.
| Metric | NVL (128 vCPU) | NVL no SHM (152 vCPU) | Degradation |
|---|---|---|---|
| Step time | 2031.5 ms | 6495.1 ms | 3.2x |
| Optimizer step | 395.6 ms | 5402.9 ms | 13.7x |
| Comm overhead | 19.5% | 83.2% | — |
| Total NCCL (10 steps) | 30.08s | 430.58s | 14.3x |
| AllGather avg | 8.715 ms | 142.656 ms | 16.4x |
| RS f32 avg | 30.937 ms | 393.702 ms | 12.7x |
| AllGather max | — | 1040 ms | — |
NCCL degrades by 14.3x when SHM is disabled. Note: the no-SHM instance had slightly more vCPUs (152 vs 128), which should have helped, making the SHM effect even more dramatic than the raw numbers suggest.